
Bitcoin's Potential 15% Drop: What It Means for Investors
Bitcoin has been a focal point of the cryptocurrency market, constantly oscillating between euphoria and despair. As it currently tests its crucial 200-week moving average, the landscape is once again shifting. Recent analyses suggest that Bitcoin may need to plunge 15% or more to mark a definitive bottom. This prediction is largely based on historical indicators and on-chain data, particularly focusing on the $50,000 to $54,000 range as a potential battleground for future price action.
Quick Take
| Indicator | Current Situation | Prediction |
|---|---|---|
| 200-Week Moving Average | Bitcoin testing levels | Potential drop of 15%+ |
| On-Chain Data | $50,000 - $54,000 range | Key battleground ahead |
What Does It Mean for Bitcoin?
Why the 200-week Moving Average Matters
The 200-week moving average (MA) is a significant technical indicator that investors often watch closely. In the past, this MA has signaled key price levels where Bitcoin has either found support or faced resistance. Historically, when Bitcoin tests this MA, it has often been a precursor to significant price movements.
Currently, Bitcoin is hovering around the critical $50,000 to $54,000 range, which on-chain data indicates could be a pivotal point for the cryptocurrency. If this range does not hold, a drop of more than 15% could bring Bitcoin down to levels not seen in recent months. Investors need to be aware that such movements can result in panic selling or buying opportunities for larger players in the market.
The Historical Context of Price Drops
Price corrections in Bitcoin are not new. For instance, during previous market cycles, BTC has experienced significant corrections, often around or exceeding 30%. In late 2017 and early 2018, Bitcoin reached an all-time high of nearly $20,000 before plummeting to around $3,000. Similar patterns have been observed during other peaks and troughs, especially when testing critical support levels.
Impact of Macroeconomic Factors
It's essential to consider the broader macroeconomic context affecting not just Bitcoin but the entire cryptocurrency market. Investors are currently grappling with high inflation, rising interest rates, and geopolitical uncertainties. Central banks around the world are tightening their monetary policies, which could lead to reduced liquidity in the markets, impacting risk assets like Bitcoin. When liquidity is low, investors may be more hesitant to hold onto volatile assets, which could amplify downward price movements.
Market Context
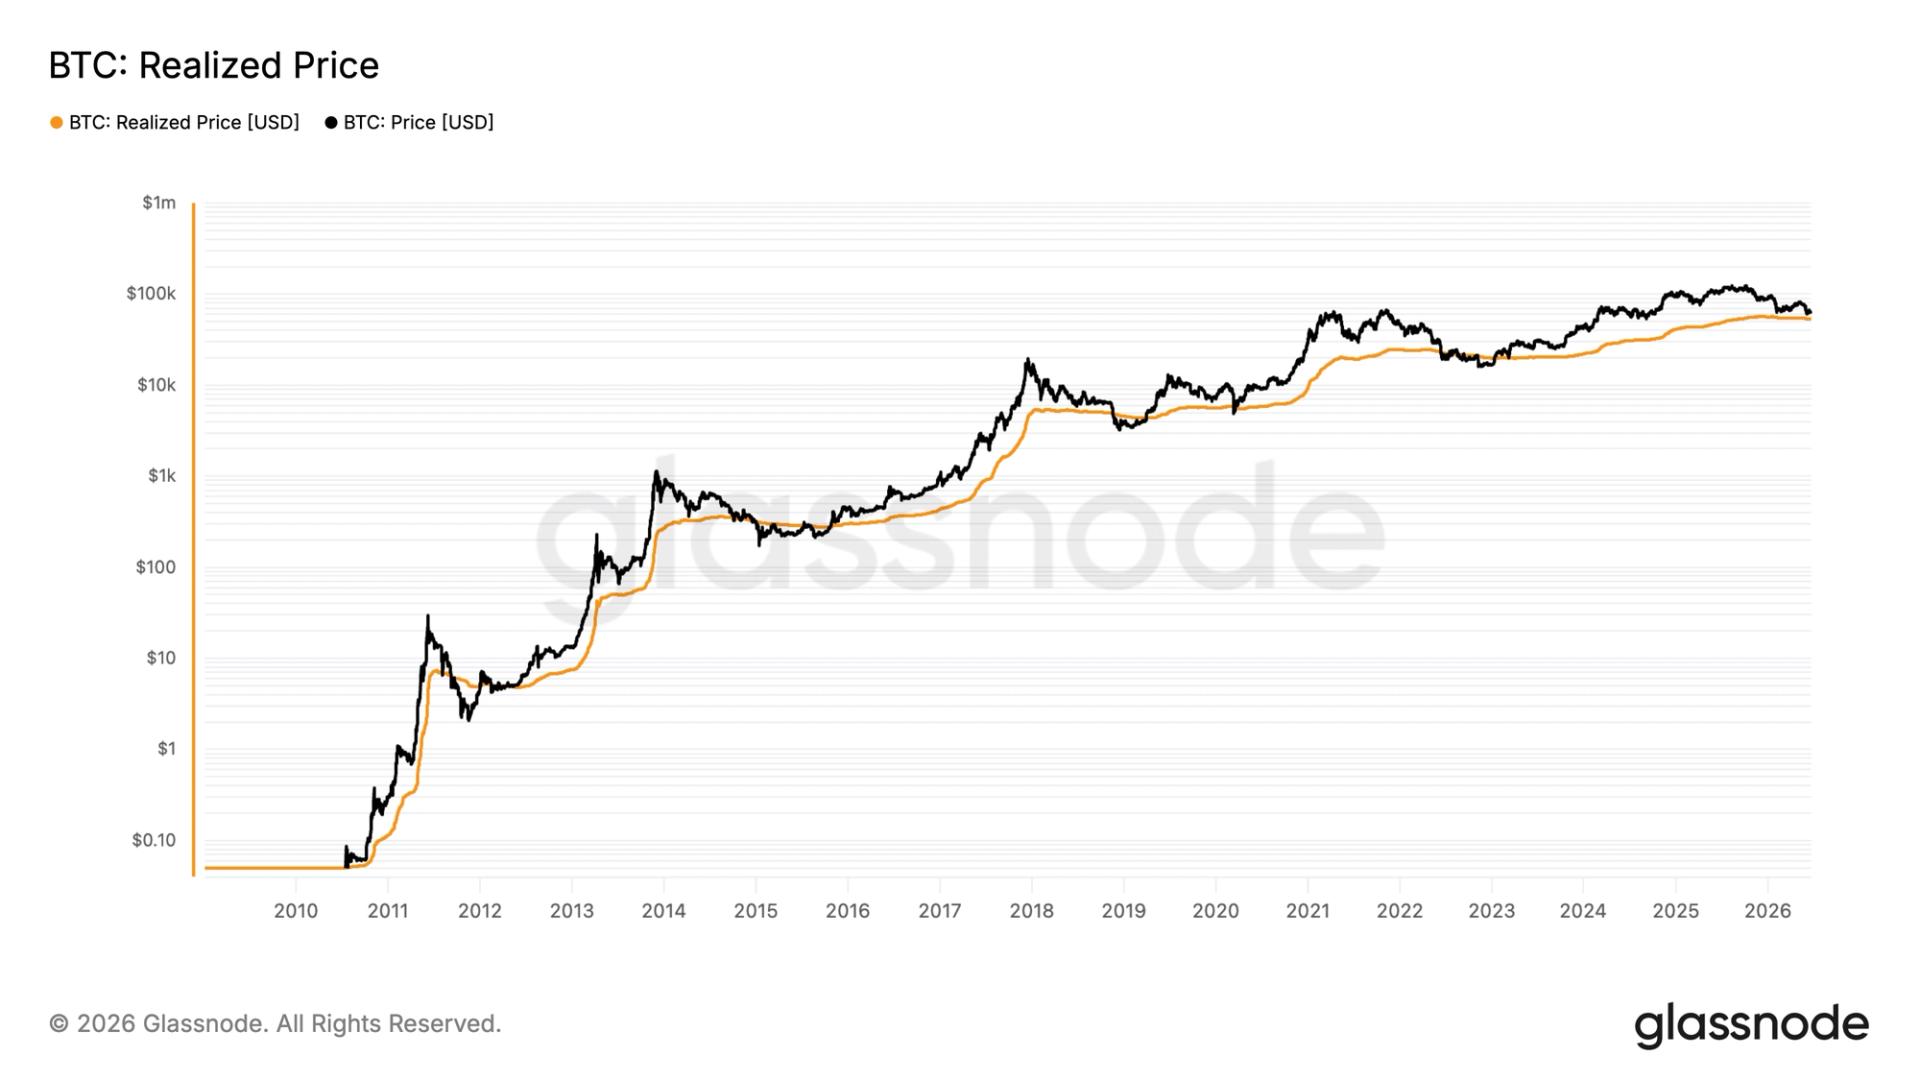
Understanding On-Chain Data
On-chain data reveals valuable insights into market sentiment and investor behavior. Currently, the analysis points to the $50,000 to $54,000 range as a potential battleground. If Bitcoin cannot secure a foothold in this range, it may trigger a wave of sell-offs similar to past corrections.
This analysis also highlights the importance of monitoring trading volumes and whale activity. If larger players (or